VIGNESH CSMSc Data Science
Mobile : +91 - 8056295120Email : csv740@gmail.com

DATA SCIENCE SKILL SET
Programming languages : R Programming,Python, HTML, CSS, SQL
Libraries : R - ggplot2, survival, GGally
Mobile : +91 - 8056295120Email : csv740@gmail.com
DATA SCIENCE SKILL SET
Programming languages : R Programming,Python, HTML, CSS, SQL
Libraries : R - ggplot2, survival, GGally
A Display of the Survival Ananlysis Model developed as part of my Data Scientist Journey.
Click on the Model descriptions to view the complete code, analysis, model and findings.
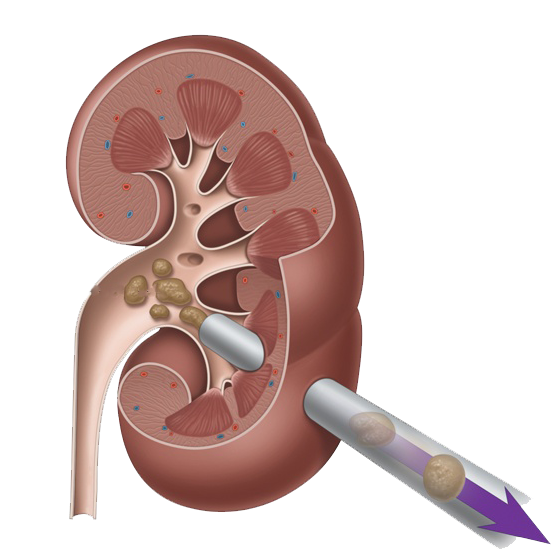
Compared the Kidney surgery patients using the COXPH model and analyzed the interaction of the categorical covariates and estimated it's benefits and benefits of Stratification

Comparing the breast cancer patient using the GLM and CoxPH model and then finally diagnosing the full COX model using residuals
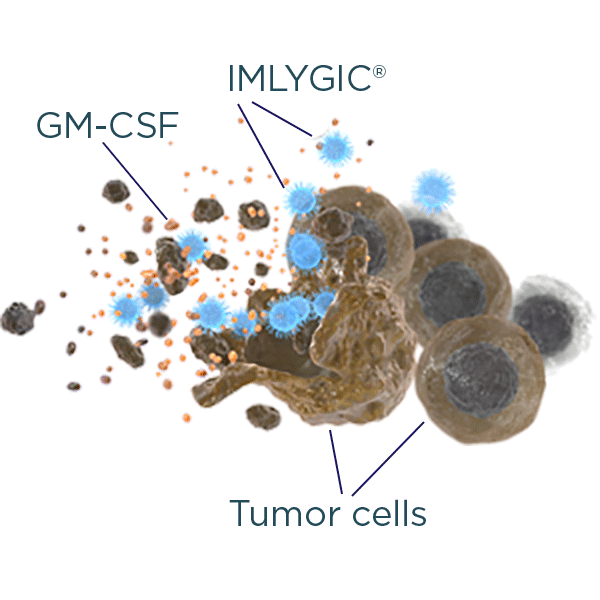
Comparing the Melanoma patients but using Non- and Semi Parametric approach and come to conclusion that Males are much affected than the Females and the Survival rates of Males goes steeply downwards than compared to males, and Visualized using Spline Semi- parametric models

By comparing both the gender we could see that which group of gender has higher chances of getting the job back after being unemployed for a period of time.
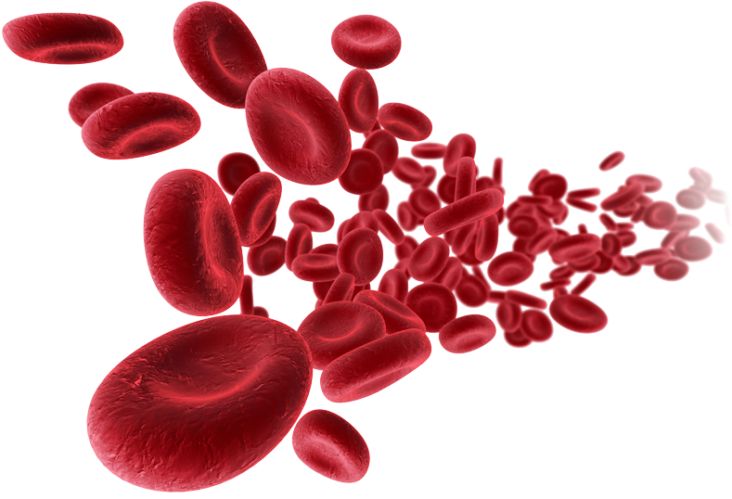
By comparing the patients who take 6-MP vs Placeba with 2 type of model and we come to conclusion that patients who are taking 6-MP treatment has higher surviving rate than Placeba treatment, and both the model assumptions are achieved, whereas only in weibull model we could see a slight violations.
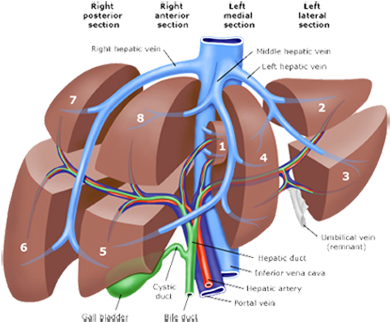
Stitistical Analysis of the liver data using the Non-Parametic and Semi-Parametric estimation
Visualization tools : Python SeaBorn,Python Plotly, R ggplot, R ggplot2
ERP tools : JD Edwards
IDE : Atom, Microsoft Webmatrix, Anaconda, Pycharm, R Studio